
DMARC monitoring
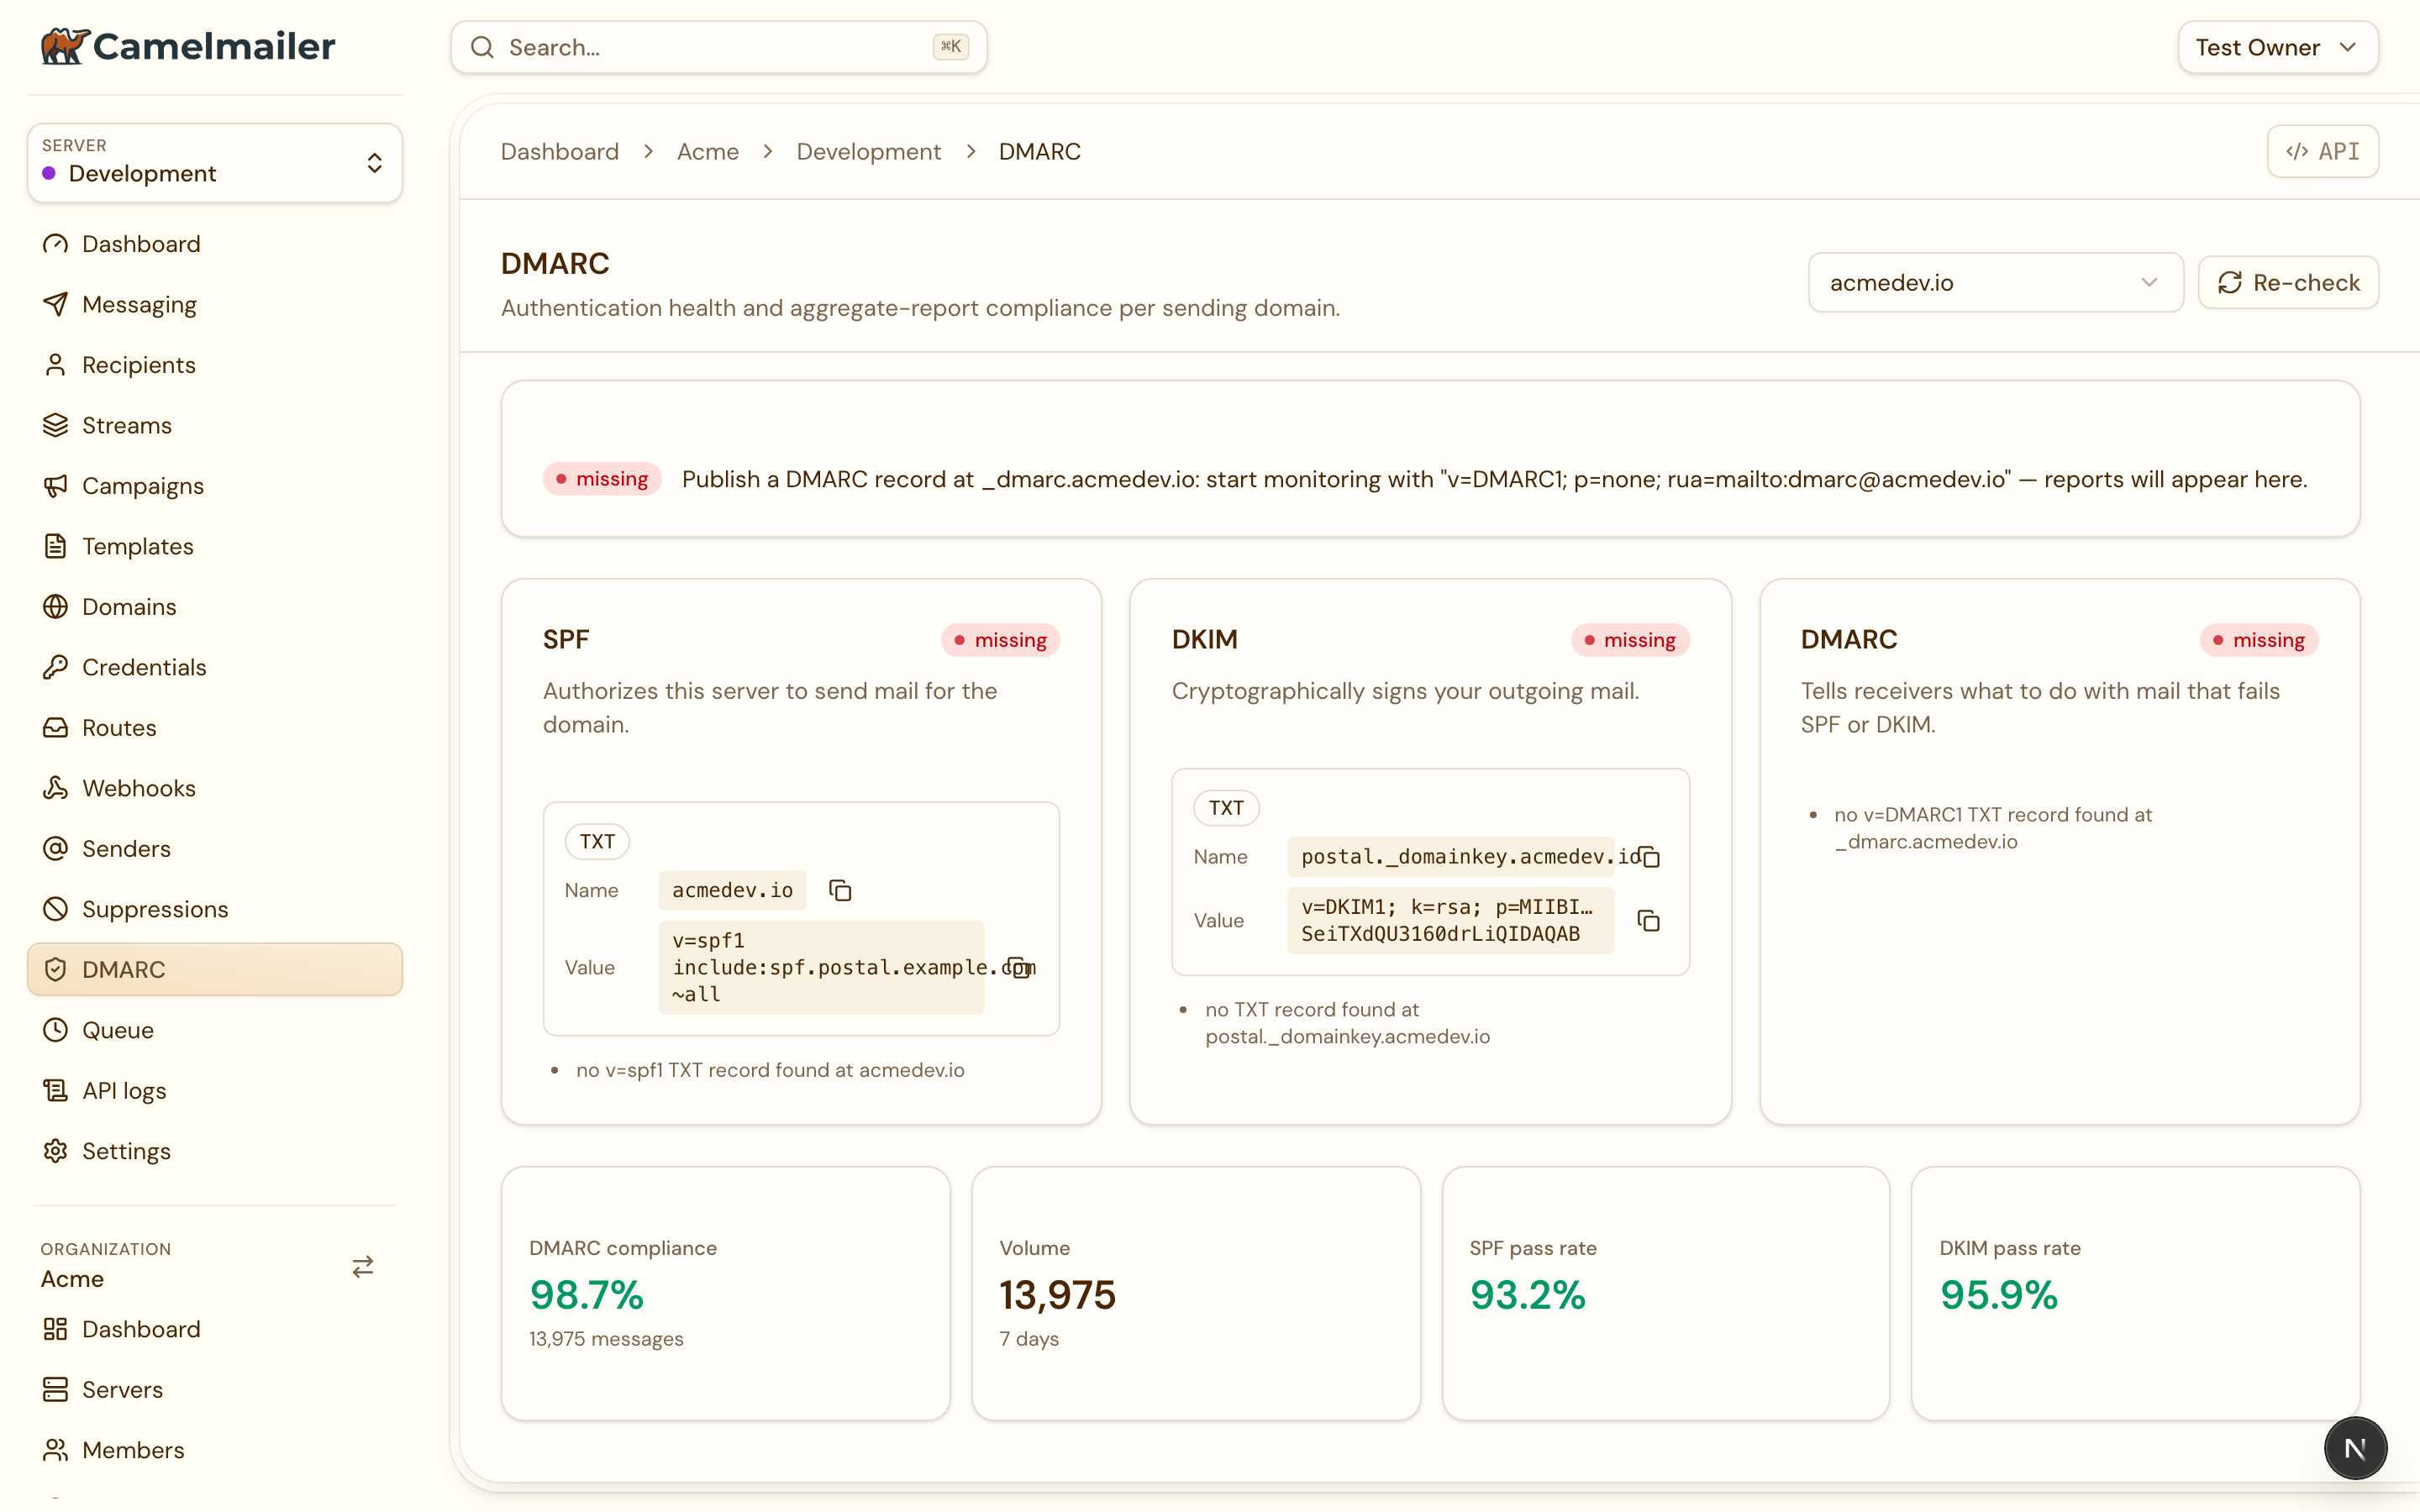
Camelmailer watches a sending domain’s authentication health and acts as the destination for its DMARC aggregate reports. The result is one screen that tells you whether your mail passes SPF and DKIM alignment, and who else is sending as your domain.
Three pieces work together on the Server → DMARC tab: a live domain health check, report ingestion through an inbound route, and a compliance dashboard that reads the stored reports. This page walks each one and shows how the dashboard turns raw aggregate reports into a picture you can act on.
Domain health check
The health check resolves SPF, DKIM and DMARC live from DNS and grades each with a traffic light and a recommended next step. It runs behind the DMARC tab and the domain detail view, and over the management API:
curl -s \
  -H "X-Admin-API-Key: $ADMIN_KEY" \
  "$API/api/v2/admin/organizations/acme/servers/production/domains/acme.com/health"
| Check | Record | Graded ok when |
|---|---|---|
| SPF | TXT at acme.com | Exactly one v=spf1 record exists, it includes this installation, and it ends in -all or ~all. |
| DKIM | TXT at <selector>._domainkey.acme.com | The published p= equals the key this server signs with (the domain’s own key, or the installation key for older domains). |
| DMARC | TXT at _dmarc.acme.com | One v=DMARC1 record with a valid p= and an rua= exists. |
Each check returns its status, the found records, the expected value ready to copy, and the concrete problems. The response also carries the overall light (the worst of the three), the parsed DMARC policy (p, sp, rua, pct), the server’s rua_address when an internal DMARC route exists, the stored compliance figures of the last 30 days, and a next_step recommendation. A DNS lookup that fails grades as warning, since that is an answer about your resolver rather than about the domain.
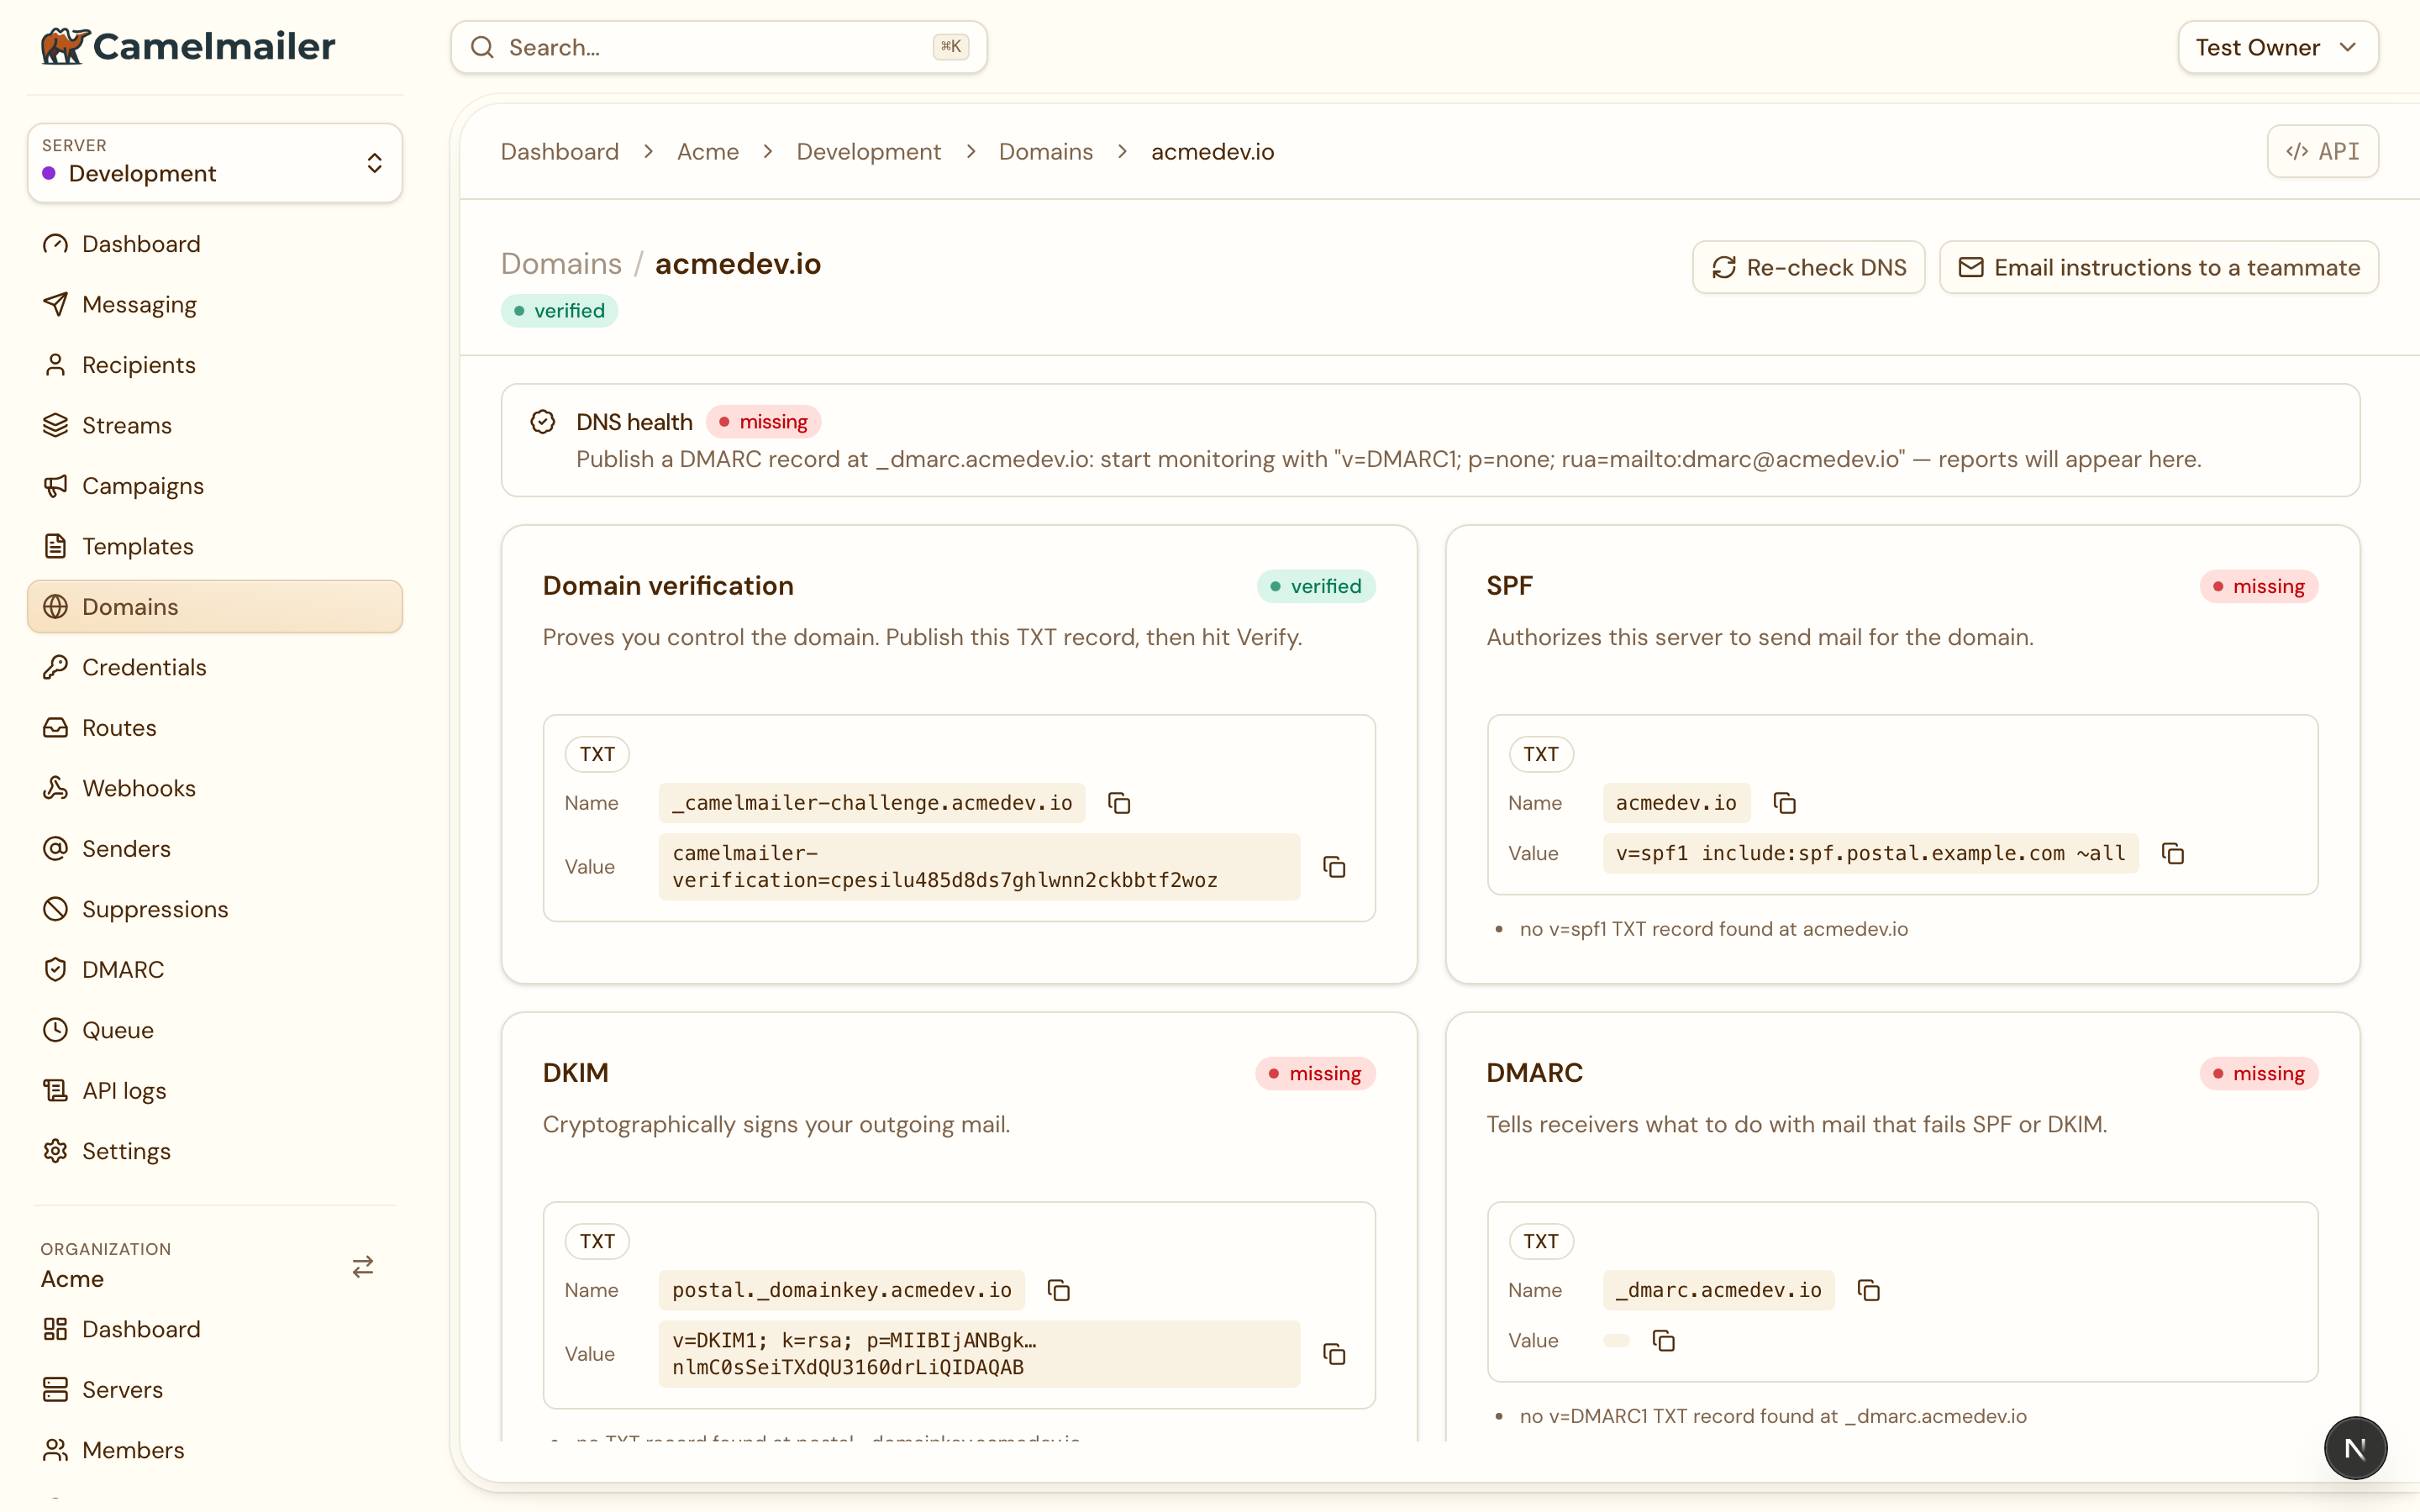
In the dashboard the same three records show as cards, each pairing the record to publish with its live status and problems. This is the same card layout used on the domain detail view.
The policy journey
The next_step recommendation walks the usual DMARC rollout, so you tighten the policy only once the data supports it:
- No DMARC record yet. Publish
v=DMARC1; p=none; rua=mailto:<your RUA address>and monitor. - On
p=nonewith the last 30 days showing at least 10 messages at a 95% or higher pass rate, tighten top=quarantine. - On
p=quarantinewith the same high compliance, consider the final step,p=reject.
One-click report ingestion (RUA)
DMARC aggregate reports are ordinary emails, so the receiving side is an ordinary inbound route with one special target: internal://dmarc-reports. Route validation accepts this value alongside http(s):// URLs.
The DMARC tab sets this up in a single action. The Set up inbound route button creates a domain-bound route dmarc@<domain> pointing at internal://dmarc-reports, then shows Inbound route ready once it exists. Doing it by hand is one call:
curl -s -X POST \
  "$API/api/v2/admin/organizations/acme/servers/production/routes" \
  -H "X-Admin-API-Key: $ADMIN_KEY" -H "Content-Type: application/json" \
  -d '{
    "name": "dmarc",
    "domain": "acme.com",
    "endpoint_url": "internal://dmarc-reports"
}'domain (the domain name), not domain_id. Then point the rua= tag of your DMARC record at that address: _dmarc.acme.com TXT "v=DMARC1; p=none; rua=mailto:dmarc@acme.com". When your RUA address lives under the same domain being reported on, no extra external-destination record is needed.When a report arrives, the worker extracts it from the message (attachments named .xml, .xml.gz or .zip, or XML directly in the body, detected by content rather than filename), parses it per RFC 7489, and stores it in the tenant’s report tables under the same row-level security as your messages. A message that cannot be parsed as a report is held with the parse error on its delivery, so a malformed report never crashes the worker. Successfully ingested messages get the Processed status.
The compliance dashboard
Once reports flow, the DMARC tab reads them back and lays out the picture. The compliance API is server-scoped (X-Server-API-Key) and only ever sees that server’s data:
GET /api/v2/server/dmarc/summary?domain=&from=&to=
GET /api/v2/server/dmarc/reports?domain=&from=&to=&page=&per_page=
GET /api/v2/server/dmarc/reports/{id}
The dashboard turns that data into:
- Headline cards. DMARC compliance percentage, covered volume, SPF pass rate and DKIM pass rate.
- A daily volume chart stacked by compliance category, so a shift in one category is visible over time.
- Category chips that filter the sources table: Compliant, Forwarded, Non-compliant and Threat.
- A provider-grouped sending-sources table with a volume figure and SPF and DKIM pass bars per source, plus the aggregate-reports table underneath.
Sending-source categories
Every record in a report is classified from its DKIM and SPF alignment. The four categories are how the dashboard separates your legitimate mail from forwarders and spoofers:
| Category | Alignment | What it usually is |
|---|---|---|
| Compliant | DKIM and SPF both aligned | Your own authenticated mail. This is the number to grow. |
| Forwarded | DKIM aligned, SPF not | Mailing lists and forwarders that keep your signature while changing the envelope. |
| Non-compliant | SPF aligned, DKIM not | A sending source that needs its DKIM signing fixed. |
| Threat | Neither aligned | Mail that authenticates as neither, including spoofing to look at closely. |
Related
Sending domains · Inbound routing · Deliverability & IP pools